Design and simulate in 2D with PV*SOL premium
PV*SOL is the 2D solar software design tool for simulating photovoltaic system performance. It is a fully-featured program for those who don't wish to use 3D to model shading, visualise the landscape or integrate with online maps.
Model PV systems in 2D
Design systems up to 100,000 modules with an unlimited number of arrays
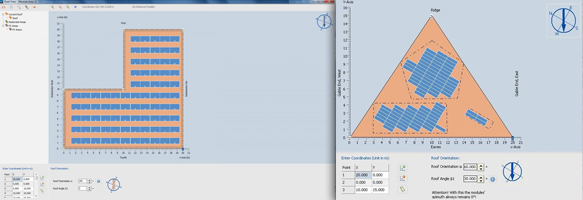
Change roof parameters
Model many different roof shapes and show modules and restricted areas
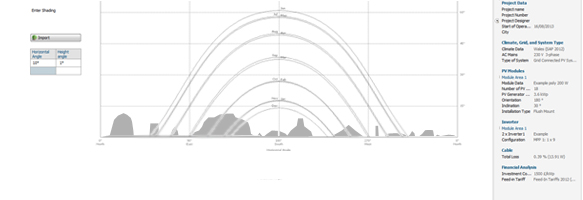
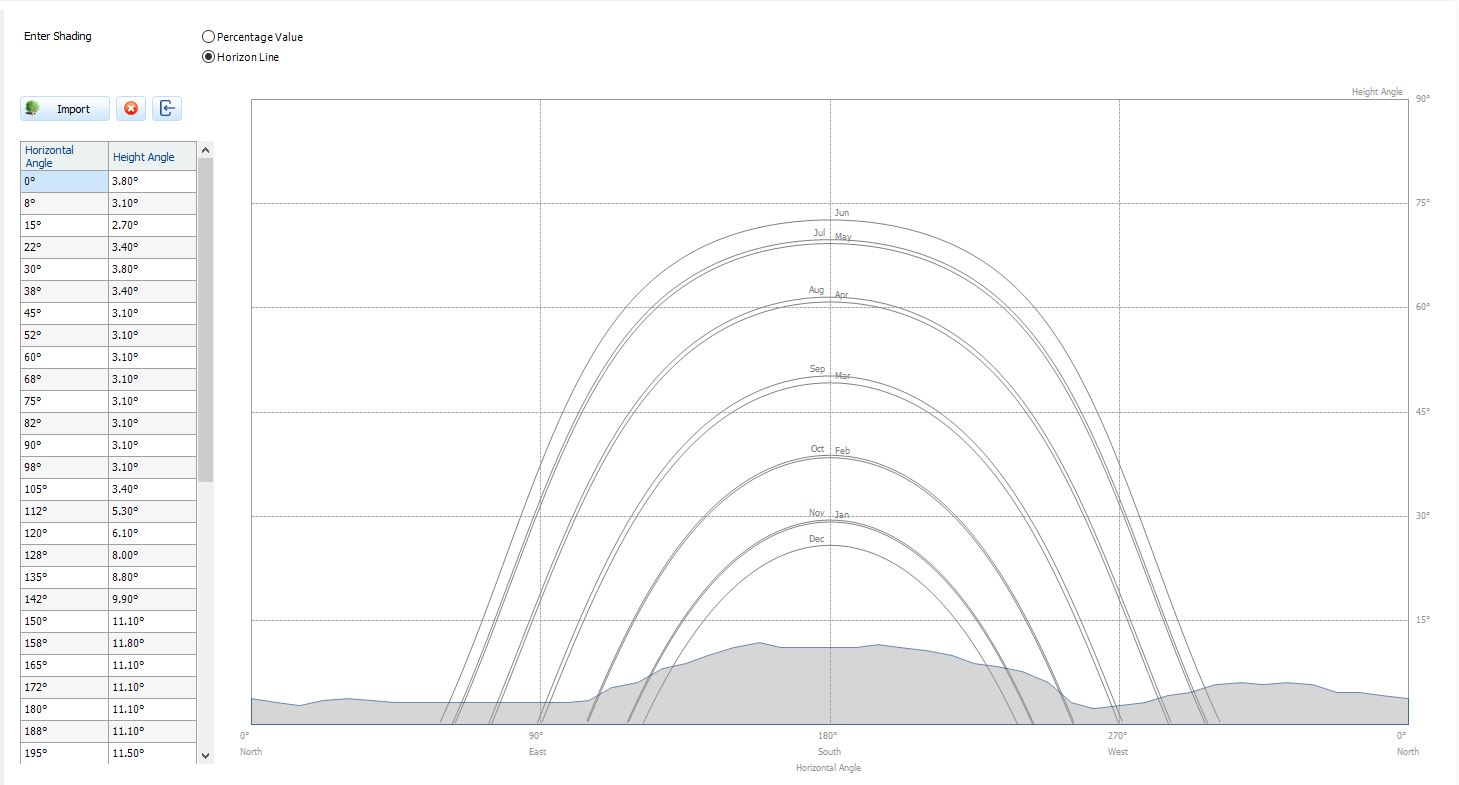
Visualise the horizon
Simulate the effects of shading in 2D
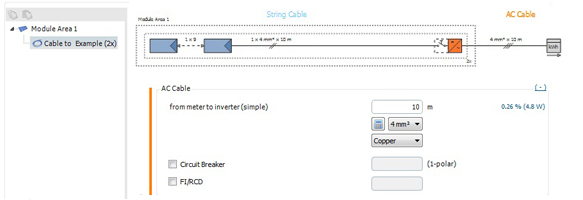
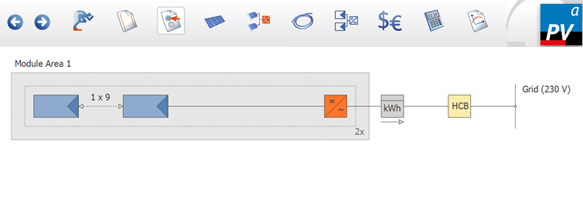
Plan wiring
Produce a wiring diagram with automatic cable sizing and export to AutoCAD
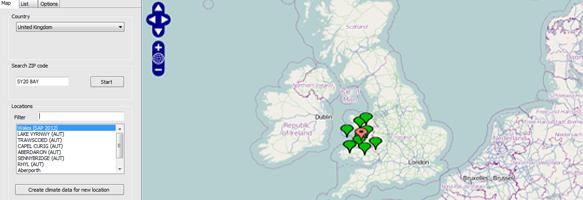
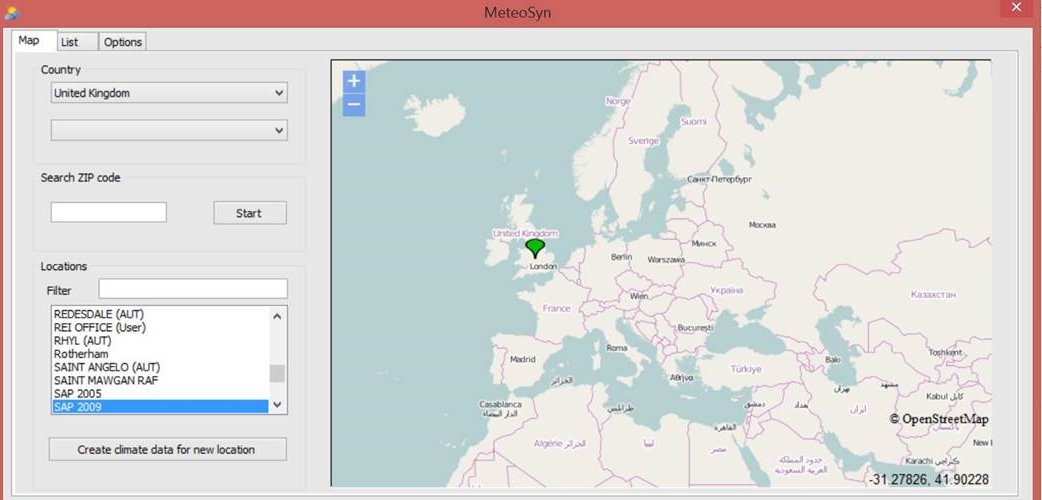
Choose from 8,000 climate locations
Interactive map for selection of climate data or create new climate locations by interpolation
Produce professional project reports
Create customer reports with precise graphs and data
Shading analysis with 2D modelling
PV*SOL is a simpler version of PV*SOL premium. Compare the two different PV*SOL versions on our comparison page 'Which PV*SOL is for me?'
PV*SOL 2026 summary of features
- 64 bit in 2D for much faster processing
- Compare modules, converters and configurations from thousands of database items
- Design PV systems with no limit on the number of arrays in 2D
- Climate locations with street-level map resolution
- Graphic 2D and Photographic roof and ground layout
- 2D shading with digital terrain import from site surveys or PVGIS online databases
- Professional and customisable report
- Visualise detailed energy balance as Sankey diagram with all stage losses
- Power clipping to reduce grid export when limited
- Customisable load profiles with smart meter data import
- Simulate battery-integrated and off-grid grid systems
- Simulation of bifacial modules for frame-mounted PV systems
- Export results to PDF, JSON, Word and CSV, line-drawings as DXF/SVG
- DC, hybrid and AC coupled battery variants
- Simulation of electric vehicles in combination with PV systems
- Create detailed editable schematic diagrams with optional safety devices
- Option to calculate photovoltaic performance of full feed-in to EN 15316-4-6
- Single and dual axis physically tracking
- Off-Grid systems
- Time of day tariffs can be defined
- Output of yield probabilities for full feed-in (e.g. P90)
- Subdivide strings to create Polystrings
- Automatic configuration for SolarEdge products and other Optimisers
- Choice diffuse irradiation modelling options
- Dimensioning to energy losses of all AC and DC cabling
- Program and report language options
- Results chart overlays
- Share custom databases with colleagues online
- Exportable parts list with auto list of key design items
- Online database and itemised parts list
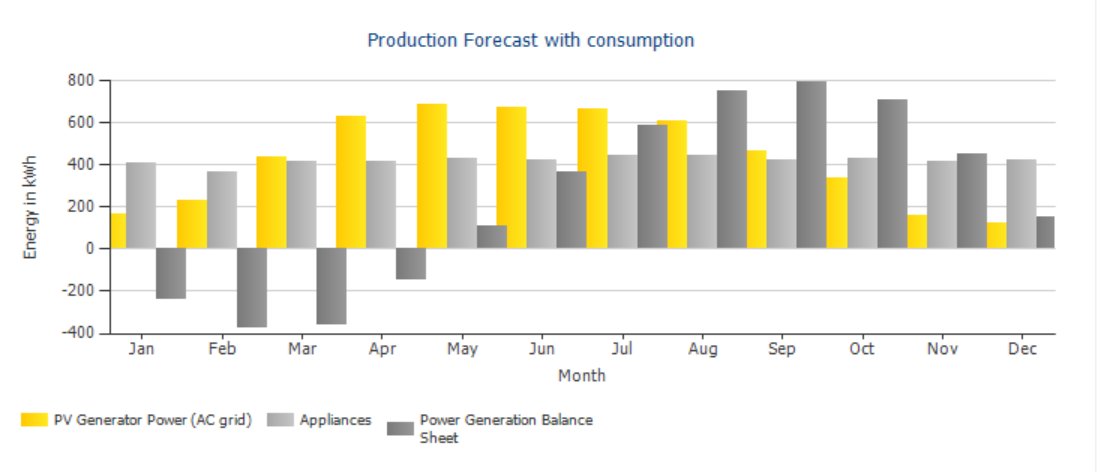
- Simulation of appliances with surplus PV energy consumption
- Integration of DHW and space heating with a thermal profile
- Import of sub-year hour-hourly load profiles
- Bundled climate files using Meteonorm V9 to 2020, PVGIS, NREL and Solcast climate files
- Direct import of PAN, OND files & PVGIS horizon terrains and xlm, .epw, .dat & .wbv climate files
- Any number of battery systems, create groups and parameterize them independently of each other
- DC-coupled battery systems freely assigned to the respective PV inverter
- Time-controlled charging and discharging for each group of battery systems
- E-car charging station with automatic phase switching
Download a free trial of this solar pv system design software from the link above
** All screenshots on this page are also for PV*SOL Premium 3D version **
2D Graphic Coverage
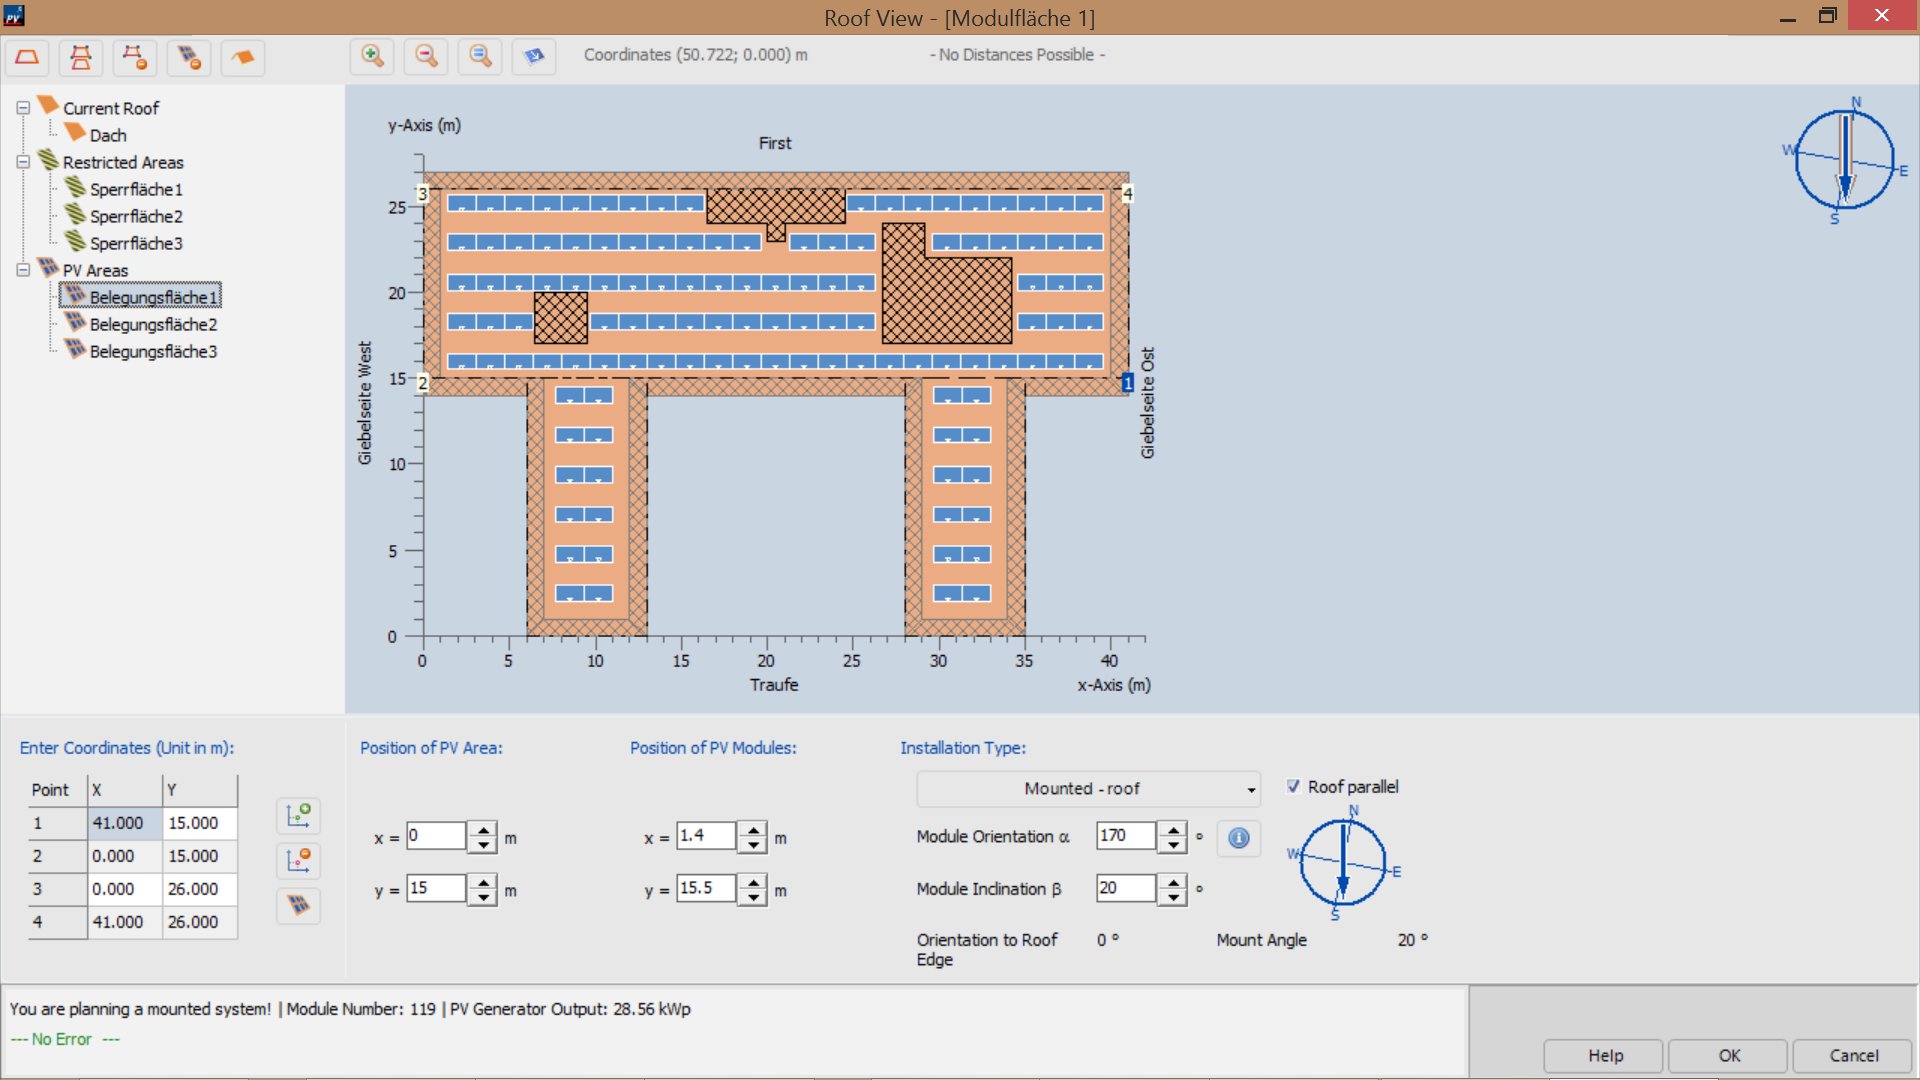
Module layout can be made from a consistent viewpoint perpendicular to the mounting surface. Custom 2D shapes can be created.
Sun path tracking
This can be modelled in various orientations including Single North-South axis; Single East-West axis; Single vertical axis of rotation; and Dual axis.
Presentation reports
PV*SOL enables definition of outputs, costs, performance indicators and CO2 fuel savings for a wide range of variables and optimise solar PV performance.
Client reports and on-screen presentations are fully customisable in MS Word. The summary report produces precise tabular and graphical representations of yields, performance ratio, solar fraction and module temperature. Reports can also be saved as PDFs. A spreadsheet result output is also possible. on-screen languages: English, German, Italian, French, Spanish, Portuguese, Czech, Turkish & Polish
Report language options include: Arabic, Bulgarian, Cestina, Chinese, Dansk, Deutsch, English, Espanol, Francais, Hrvatska, Italiano, Magyar, Nederlands, Norsk, Polski, Portugues, Romanian, Russian, Shqipe, Slovensky, Svenska, Turk, Bengali, Lithuanian.
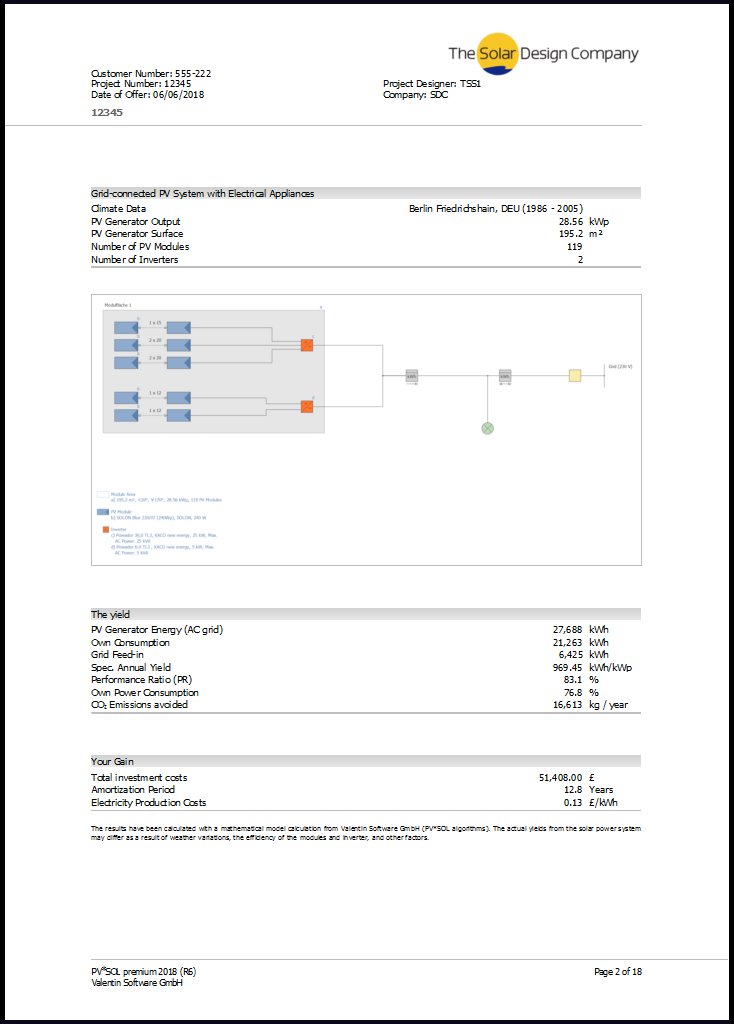
You can see the outputs of PV*SOL premium in project report form, either for a domestic or commercial system.
PhotoPlan
PV*SOL includes the PhotoPlan option. With just a photo of the roof and a few reference dimensions, you can create a realistic representation of the property as it would look with installed panels. These can be included in customer reports and offer a useful tool for the design process in deciding where arrays should best be placed.
Mixtures of PV and solar thermal images can be imported, combined with Velux roof windows and multiple roof tile forms and colours.

Climate data
PV*SOL comes with Meteosyn climate data software. This comes pre-loaded with thousands of global climate data locations.
Terrain import
PV*SOL gives direct terrain profile import via map selection as 2D shading.
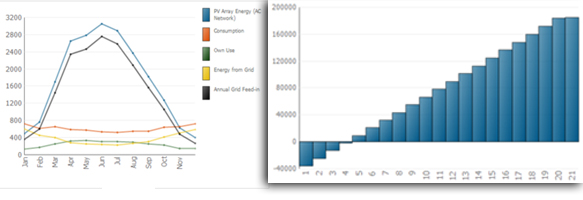
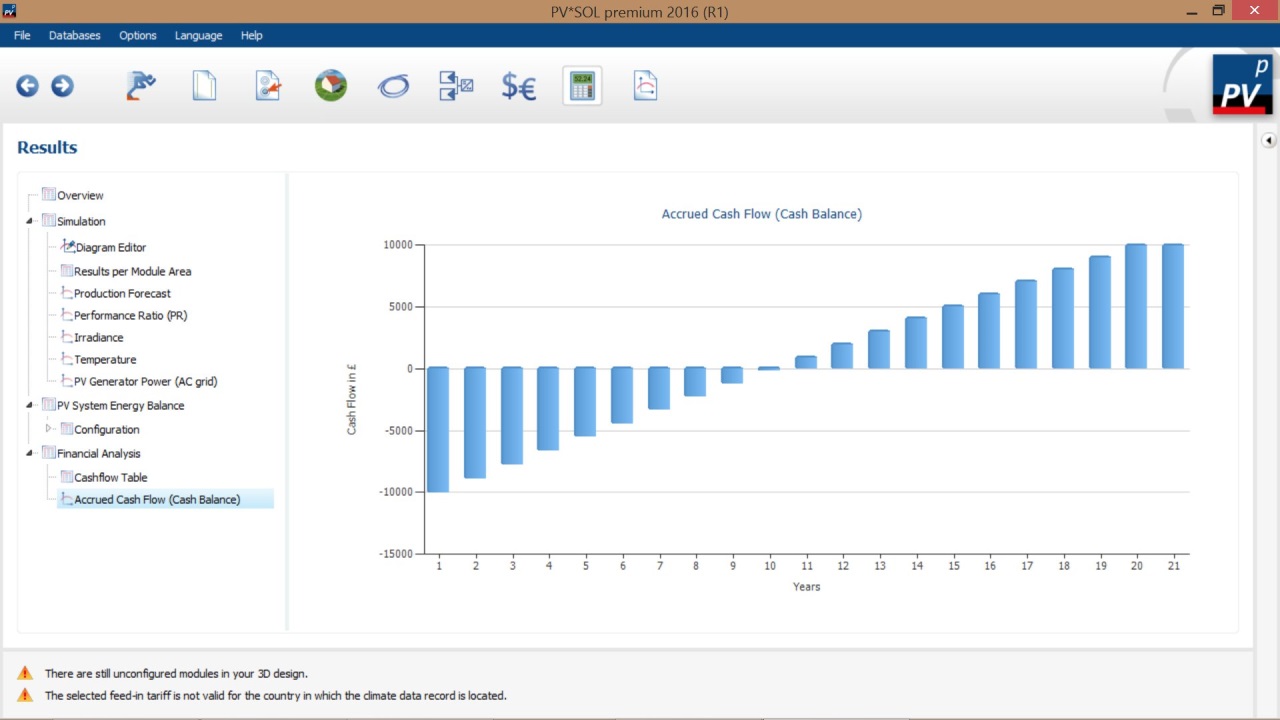
Financial analysis
Tabular and graphical financial analysis of system performance is possible. Annual cashflow results can exported to a spreadsheet and the program includes Return on Investment, Amortization (payback) and energy subsidies (both fixed and per kWh) with inflation factors. Time of Day (Time of Use) to each hour can be described.

Roof parameters
Module coverage can be calculated automatically and a roof layout diagram can be included in the project report. It is also possible to design mounted (framed) modules to face any direction. An 'optimum row distances' dialogue assists with the spacing of mounted arrays.

Energy Flow diagram
The principle annual energy flow totals can be visualised on a single diagram. This can help explain complex situations.

Electric Car Option
The electric car option means it is easier to define a movable battery. It is also possible to combine this option with a static battery.

Grid-connected batteries
Choose between AC-coupled, DC-coupled and hybrid with over 10 battery construction types.

Thermal design
Design in heat pumps and resistance water heaters.

Information and Resources
PV*SOL 2026
(3 months rental)
£171.60
PV*SOL 2026
(12 months rental)
£514.80
All prices shown without tax
Buy Now Request a pro-forma invoiceImportant:
The license model for PVSOL premium, PVSOL, TSOL, and GeoTSOL are rental and no longer perpetual.
Visit Valentin Software GmbH's FAQ page for more details.