Adapting PV*SOL to a country's typical setting
PV*SOL can quickly produce results as soon as it is opened for the first time. For improved accuracy, detailed adjustments are made to the parameters to suit each individual project. For initial analysis many parameters can either be left in their default setting or repeated by starting from a previous project. For more complex systems, adjusting the values correctly requires practice and experience. Our training can help to familiarise you with how best to make these adjustments.
PV*SOL contains default settings and databases that are best adapted to match typical values expected for each country and location. This is in addition to selecting the correct climate. We recommend that all values are revealed where requested to support simulation reports.
CO2 Saving
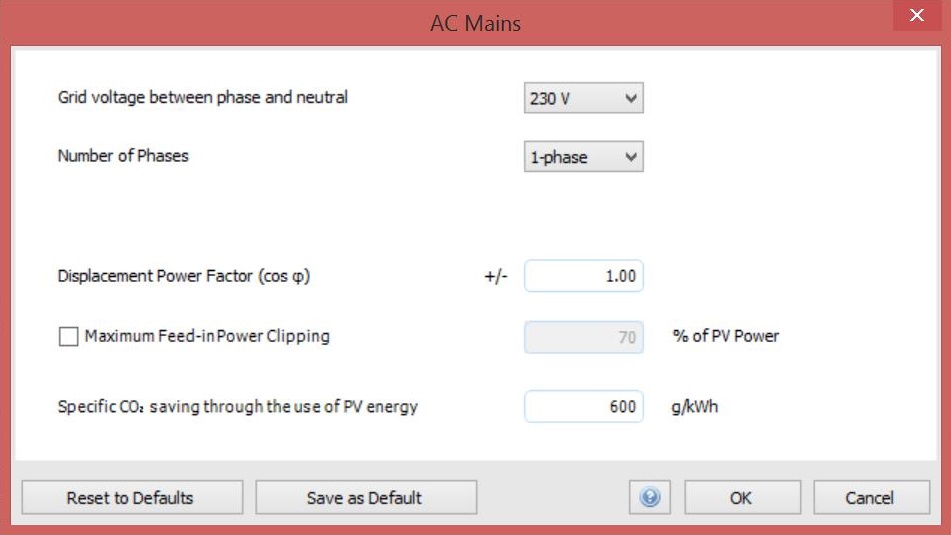
The default CO2 values used in PV*SOL are based on German values (470g/kWh). The screenshot image below shows the dialogue with the AC mains section of the climate, grid and system type tabs. It is possible for the user to alter these values and save as default.
Example Emission figures for UK from 2010
The table of figures below shows UK figures derived as an average over the last 10 years from two government sources:
- The National Atmospheric Emissions Inventory (NAEI)
- The Department of Energy & Climate Change (DECC)
| Emission Type | UK DECC/UNECE |
|---|---|
| CO2 (g/kWh) | 429 |
| Carbon Monoxide (mg/kWh)(g/kWh) | 97 |
| Nitrogen Oxides (mg/kWh) | 49 |
| Sulphur Dioxides (mg/kWh) | 989 |
| Non-Methane CH (mg/kWh) | 1,218 |
| Particulates (mg/kWh) | 154 |
Note that electrical fuel mix changes on a daily basis but that published figures are normally annual. A prediction of how the CO2 content of grid mains electricity might change in the near future is shown in the following chart; and for CO2 displacement estimates an average figure for the years ahead could arguably be used.
Example UK electrical CO2 power emission figures from 2017
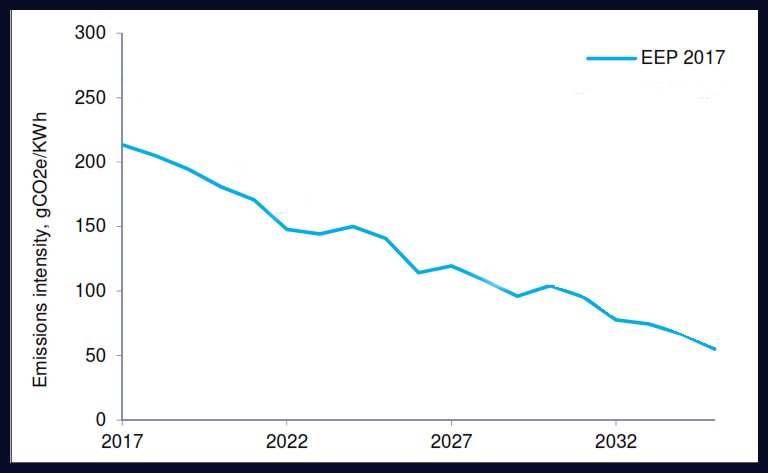
This chart shows a trajectory of power sector CO2 emissions intensity between 2017 and 2030. For example in 2030 the projected emissions intensity is 104 gCO2e/kWh. Source Updated Energy and Emissions Projections 2017 (EEP2017) BEIS Jan 2018
Another alternative are the CO2 figures from the UK's Standard Assessment Procedure (SAP). For the 2012 edition, this is shown as 519g/kWh but that appears quite high compared to the chart above.
The SAP10 technical documents SAP 10 technical indicate a figure of 136g/kWh
Further information can be found here or here or The National Grid daily CO2 Intensity.