Solar PV Case Study
The choice between shading survey methods and resultant variance of solar PV predictions
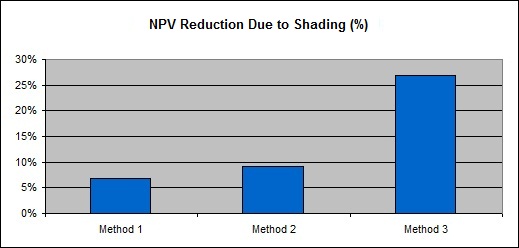
In light of the new MCS shading requirements, The Solar Design Company performed an experiment to see how varying the accuracy of shading estimation affected the predicted outputs of a case-study solar PV system. This comparison showed a 20% difference in Net Present Value (NPV) reduction over 25 years between the results of three different survey methods, including the method recommended by the MCS.
Introduction
When it comes to solar installations it does not always make sense to fill a roof to maximum capacity. For PV
especially, a difference of one underperforming module can have a serious impact on the
accuracy of predictions. The following case-study simulations compare three different survey techniques to see
how increased accuracy would affect predictions. For this The Solar Design Company's
office was chosen.

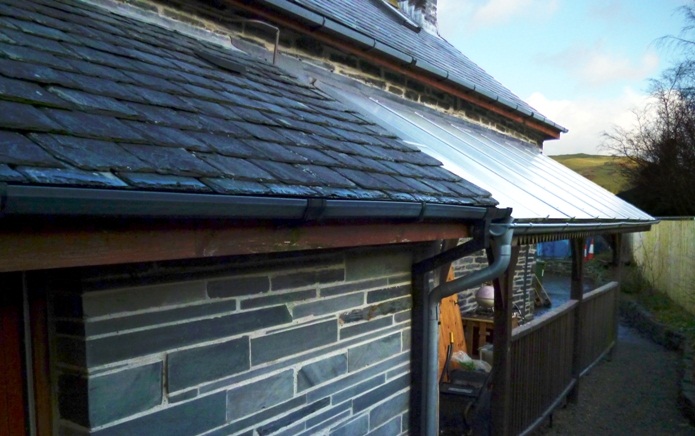
The office is situated in Machynlleth, mid-Wales, so unless otherwise stipulated all estimations used climate data specific to this location. The rear roof of the building was chosen because this is oriented south-east. The roof experiences shading in the afternoon caused by a set of buildings and trees, including one large building situated particularly near to the office. Machynlleth is in a valley, surrounded by hills which can also be assumed to affect irradiation levels and therefore solar PV yield.
Survey methods used to estimate shading:
- 1. Overhead aerial photo only.
- 2. MCS method assisted by a Solar Site Selector.
- 3. Full digital horizon survey.
The financial and energy generation consequences of each of these methods were then compared using PV*SOL Expert 5.5 simulation software with an hourly climate file for that location.
1. Overhead aerial photo:
This remote survey method is commonly used by installers who feel it is too time-intensive and costly to visit a site. Google Earth and its ruler tool were used on an office computer.
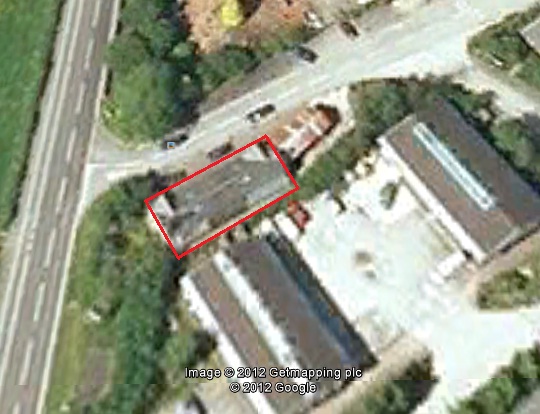
Using only an overhead image there was no way to check what the pitch of the roof was. Some features of the roof could be seen but were lacking clarity. The nearby trees and buildings were visible, as well as the surrounding hills, but their heights could not be measured.
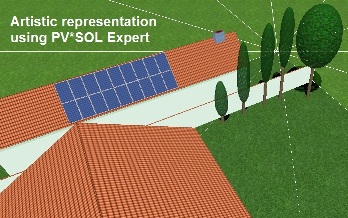
A digital representation of shading using this method was made in PV*SOL Expert and is shown below.
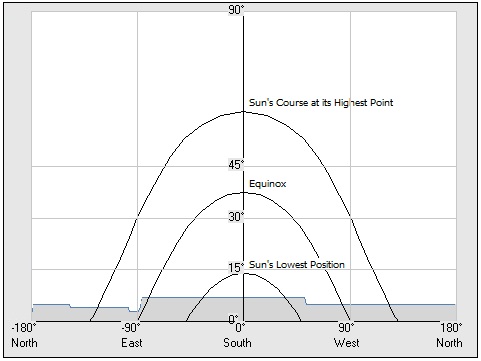
An assumption was made that the shading caused by the hills was 4 degrees from the proposed panels, and that the secondary building near the office was slightly higher than the proposed PV array. However, it was not possible to tell how great the height difference actually was, or to gauge the exact distance between the building and surrounding objects. There is therefore a high margin of error with this method. The roof pitch was assumed to be 35o. These dimensions were programmed into PV*SOL Expert with a generic poly-crystalline 200Wp module.
2. MCS method:
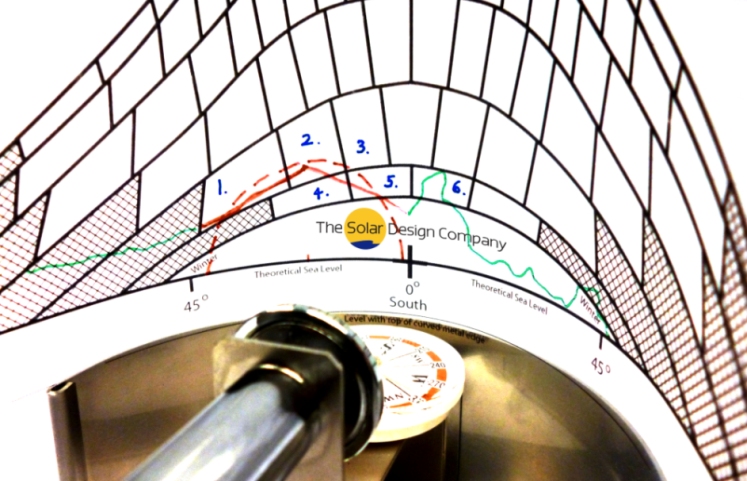
A Leica DISTO was used to gather precise information about the building, including height, width, depth and orientation, all taken from ground-level. This ascertained that the roof pitch was actually 42o rather than the 35o assumed by the aerial method noted above. In accordance with the MCS method, a landscape sketch was created on a sunpath diagram. This was aided by the use of a Solar Site Selector tool in order to ensure the correct compass direction and angular elevation were measured.
One problem with this method was that a nearby fence stopped this method from being used reliably at ground level. The only solution was to use it nearer to roof level, and it was fortunate that a nearby roof skylight was present to easily allow this.
The Solar Design Company has created a special 52o latitude sunpath foil designed to fit their Solar Site Selector survey tool. This foil is FREE to download and can be used with the Solar Site Selector as an aid to the MCS method. Click here for more information about the MCS method.
Referring to the MCS Solar PV Guide called 'Guide to the Installation of Photovoltaic (PV) Systems', the first step in this method was to choose the closest climate region from a series of options, which in this case was 'Wales'. From a choice of tables for each region, the measured roof pitch and compass direction indicated a specific energy yield of 896kWh/kWp. This was then multiplied by the size of the array (3.6 kWp) to give an annual energy figure without an allowance for shading of 3226 kWh per year.
The landscape sketch (shown in green and red ink on the photo above) showed that shading was present in 10 of the 'boxes' on the foil. The green line represents objects more than 10m away from the proposed PV site, while the red line represents the large building previously described as this was closer than 10m. The red dotted line was drawn as a circle using the apex of the building as its radius. Under the MCS method each non-crosshatched box corresponds with a percentage reduction in yield, so if 10 boxes contain shading then this initially represents a 10% loss of AC output yield. However, 4 of those boxes are crosshatched and therefore do not count; so under the MCS method this actually represents a 6% loss of AC output yield. The annual energy figure was reduced to 94% (1 - 6 * 0.01 = 0.94). The final energy figure for the array using the MCS method was 3032 kWh per year.
3. Full digital horizon survey:
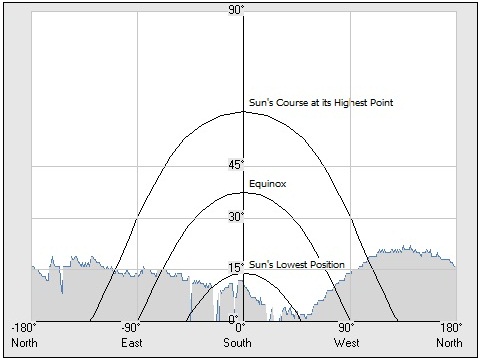
To compare with one of the most accurate methods on the market, a full 360o panoramic fisheye image was taken using the Solmetric SunEye 210 GPS tool. It was possible to achieve this task completely from ground level as the SunEye has an optional extendable mast that raises the tool up to the proposed array height to capture the landscape image. This image was then automatically converted into a digital shading file for use in PV*SOL, which gave a much more detailed picture of the horizon and shading objects as shown below:
The building dimensions remained the same as the second method, as these measurements had already been taken with this.
This comparison between the three survey methods showed a 20% difference in Net Present Value (NPV) when analysed over 25 years using the same financial assumptions throughout:
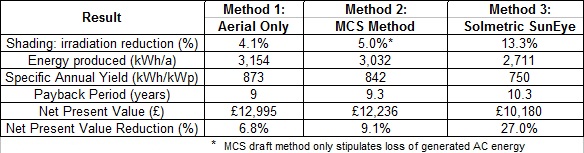
This difference in NPV reduction is visually represented by the graph at the top of this page.
Conclusions:
At current prices, this would leave a customer with over £2,500 less at the expected end of life of the array than originally promised using the remote aerial method compared to the full digital horizon method. The MCS method is strongly reliant on obtaining a vantage point at the same height as the proposed array, as well a steady hand to acquire accurate skyline measurements. The Solmetric Suneye 210 GPS provided automatic compensation when acquiring skyline measurements and allows safe, reliable measurements to be taken from the ground.
Further information:
- See here for more information on the MCS shading analysis method.
- Find out more about PV*SOL and T*SOL software.
- Measure the horizon simply with the Solar Site Selector or comprehensively with the Solmetric SunEye