The MCS site-survey method to anticipate solar PV shading
The UK's Microgeneration Certification Scheme (MCS) released their Solar PV Guide called 'Guide to the Installation of Photovoltaic (PV) Systems' detailing requirements for solar PV installations. The published version indicates that installers will be required to record a shade or horizon line on a sunpath diagram to present to clients. The Solar Design Company now runs training courses in MCS Shading and Solar Surveying.
The Solar Design Company has created a special 52o latitude sunpath foil designed to fit their Solar Site Selector survey tool.
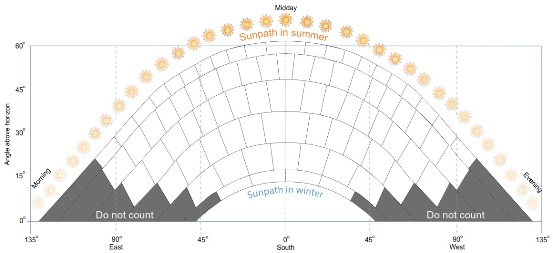
Sunpath diagram from MCS PV Guide (p.63)
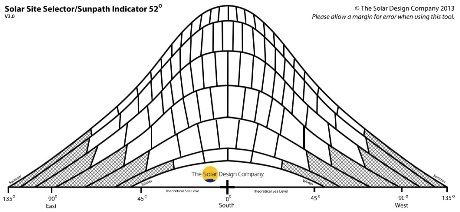
The Solar Design Company Solar Site Selector foil
Frequently asked questions:
- What is the Solar Site Selector?
- How much does the Solar Site Selector cost?.
- How does the MCS Solar PV Guide shading method work?
What is the Solar Site Selector?

The Solar Site Selector is a small but useful tool for anyone who wishes to quantify solar energy such as by solar thermal, PV and Passive Solar Heating installers.
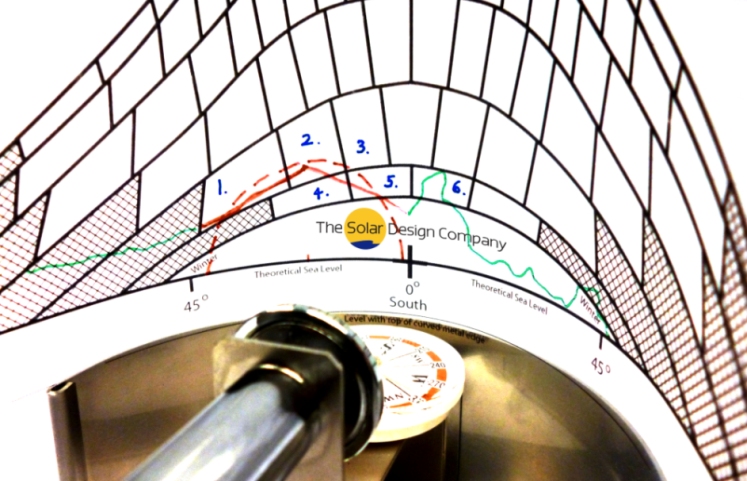
The tool includes a sunpath diagram (the 'foil') which is printed on to a transparent acetate. This slots into the Solar Site Selector, which contains a fisheye lens and a compass and can also be used with a wide range of different 'foils' from 36o to 60o latitudes.
By looking through the lens, installers can identify objects in the scenery behind the foil which could obstruct solar radiation. The outline of these shading objects can be drawn on the foil with non-permanent marker so that it can be reused for each site.
See here for more information about the Solar Site Selector.
How does the MCS Solar PV Guide shading method work?
The MCS method uses boxes on the sunpath to estimate shading. Each box on the MCS diagram represents a part loss of system yield and the boxes are different shapes and areas. For each box that contains some aspect of a shading object, these are counted and multiplied to reduce the optimum output if there were no shading. Some of the boxes on the MCS diagram are crosshatched, which means that they should not be counted as part of the system yield loss.
Shading objects that are within 10 metres of the centre point of the proposed array require a circle to be drawn onto the sunpath diagram. The apex of this circle should sit at the top of the shading object and the radius of the circle should be the height of the object (see image below).
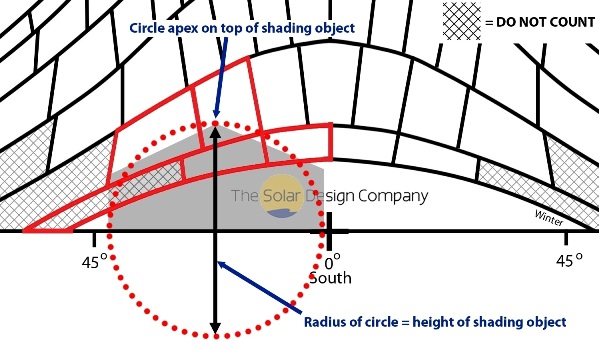
In this example, the red part of the line is within 10 metres of the proposed array, so a circle is added (dotted), with the top of the object at the apex of the circle. In total, this shading line passes though 6 boxes. Under the MCS method this represents a 6% loss of AC output yield. In this case the installer would multiply the total predicted optimum yield by 1 - (6*0.01) = 0.94. View a shading case study here to see the calculation process in more detail.
Note: the MCS method may be subject to change in later versions so please refer to the MCS Solar PV Guide when making calculations. Landscape sketches should be transferred on to the official MCS sunpath diagram and near-shading circling undertaken there.
Further information:
- Contact us to purchase further 52o latitude MCS-aid foils.
- Find out more about the Solar Site Selector.
- See the MCS method compared to other shading methods with The Solar Design Company's PV case-study, available here.