PV*SOL Frequently Asked Questions
Setup and Error Messages
- Some 3D dialogue windows truncate or miss parts out ?
- Trying to open the databases is becoming slow and a 'Not Responding' message appears.
- The Consumption page icon has disappeared from the menu bar in PV*SOL. What do I do?
- How do I resolve the server connection errors?
- How to edit the recent projects list ?
Building and site modelling
- Which 3D formats can be imported in PV*SOL Premium ?
- Can PDFs drawings be imported into PV*SOL ?
- Can you model a roof that has two different orientations in 2D?
- Can I plan the roof coverage for a PV system from the roof dimensions?
- How can I represent contours or undulations in 3D ?
- Can PV*SOL be compared to PVSYST ?
Configuration
- How do I use the 'SolarEdge' power optimiser and inverter system in PV*SOL?
- How can a MPP be allocated different parts of the strings ?
- What happens if I use 'Configure Modules Areas Together' ?
- Is there a limit to the system output in PV*SOL?
- Can ground and roof frame-mounted systems be simulated with PV*SOL?
- How do I calculate the optimum row distance between modules for free-standing (mounted) arrays?
- When can roof-parallel or roof-integrated module installation situations be specified during 3D planning in PV*SOL premium?
- Can PV*SOL calculate systems with physical tracking?
- How can climate files be used from other specific sources like MCS or PV-GIS?
- Can I select "Tigo" power optimisers?
- How do I use Enphase micro inverters?
- Is it possible to choose which array/inverter the battery systems or hybrid inverters connect to ?
- Can bifacial modules be simulated ?
- How can I model a grid-connected scheme so there is limited or zero export to grid ?
- How can self-consumption be maximised?
- Are the wiring dialogues compliant with the wiring regulations
- How to put Cable Plan schematics in the report
Results
- Where are the results for mains voltage, power clipping or down-regulation found in PVSOL?
- Why do I get such a difference in yield in the simulation of different modules, even though they have the same rated power?
- Why is the specific annual yield for amorphous modules better than for monocrystalline modules, even when the systems are the same size?
- How are thin-film modules treated in PV*SOL calculations?
- Can you print the roof layout in PV*SOL?
- Would it be possible to guarantee that the predictions generated using PV*SOL will be matched by the actual output after installation?
- Does the PV*SOL system schematic show isolators on the report to the customer?
- How do I get results for the module temperature during operation?
- How do I create results for every half-hour of year ?
- How are the terms Gross PV Surface Area and PV Solar Surface Area defined? Why are the values different in some cases?
- Where are the losses due to shading shown ?
- How are the electricity production costs calculated?
- What is the definition of the performance ratio (PR) ?
- How is the peak consumption power calculated and how can it be changed ?
- How can I change the images used in the presentation report?
- How can the results chart 'Cumulative Total Energy Generation' show just the AC inverter generation ?
Database Questions
- How do I import a load profile such as Half-Hourly (HH) from a Smart meter?
- How can I find out whether the latest version of the module database is installed on my PC?
- How do I add modules, batteries or inverters I want to use to the database?
- Where does the data for determining the CO2 savings come from? ('CO2 Emissions avoided' in the project report.)
- How to adjust the CO2 grid rate over time
- Where can I find definitions of common terms used in the PV*SOL report?
- What is the 'energy from grid'?
- How do I copy over my user-created database items and favourites when changing my program version or transferring my license?
- Why can't I find Tesla and similar products in the battery system database?
- Are there load profiles suitable for the Southern hemisphere ?
- Can online sources of 2D terrain profiles be imported into the 2D shading diagram?
- How do I select 'From-grid' electrical tariffs that vary during the days or seasons?
- How do I view the part load data for a module?
- Can PAN format files for modules characteristics be imported into PV*SOL?
- What is the ‘Emissions Coefficient’ in the module database specification ?
Economic Questions
- Why can I not see the choice for Surplus or Net metering concepts instead of only full feed-in? And why does the From-grid tariffs or Bankability sometimes not appear in the Financial Analysis ?
- How do I use the current UK FiTs in PV*SOL?
- I have to load my preferred feed-in tariff each time I set up a new project. Is it possible to save the tariff settings to be used for new projects centrally?
- Does PV*SOL know the capital cost or exchange rates of any items?
- In the results, why does the Feed-in/Export tariff cashflow rate change every year and differ from the utility payment?
- I am involved with a Power Purchasing Agreement - how is this represented in PV*SOL?
- What effect does the starting date have on the economic calculation?
Setup and Error Messages
-
Some 3D dialogue windows truncate or miss parts out ?
This can be due to the Windows screen resolution settings especially using 4K monitors and a Windows scaling factor higher than 100%. Within 3D, the spanner symbol gives an option to enlarge the icons. It may be also possible to adjust by a right-click on the shortcut (desktop icon) used to start PV*SOL premium. Then go to the Properties -> Compatibility tab and select 'Change high dpi settings'. It is the lower of the two options i.e. 'Override scaling setting ...' and then select "System”. the 'Apply' or OK. Also try plugging in another external monitor and alter your Windows display setting resolutions as this can at least remove the issue in the short time
Back to top
-
Trying to open the databases is becoming slow and a 'Not Responding' message appears.
When accessing your equipment databases in PV*SOL, it becomes slow to open, possibly due to too many favourites being selected. In this case try reducing the number of favourites via the Main Menu > Databases > Manage Favourites
If the Cloud symbol appears it maybe the online database is not connecting. This often resolves after a few moments but if not the offline database option can be enabled in Options > Databases
Back to top
-
The Consumption page icon has disappeared from the menu bar in PV*SOL. What do I do?
Please ensure that you have selected a 'Net Metering with electrical appliances' system type on the 'Climate, Grid and System Type' page.
Back to top
-
How do I resolve the server connection errors?
This may occur if the Valentin server is temporarily unavailable or you have intervening firewall or other impairment to the Internet.
For IT personnel setting up firewalls, the following servers need to be accessed by PV*SOL:
- solar-software.de
- http://downloads.valentin.de
- http://www.valentin-software.com
- For the map view different URLs are needed depending on the selected map type:
- Openstreetmap, the maps are delivered by the following servers:
- http://a.tile.openstreetmap.org
- http://b.tile.openstreetmap.org
- http://c.tile.openstreetmap.org
- https://db-api.pvsol.de
- Bing (3D map import):
- http://ecn.t0.tiles.virtualearth.net/
- http://ecn.t1.tiles.virtualearth.net/
- http://ecn.t2.tiles.virtualearth.net/
- http://ecn.t3.tiles.virtualearth.net/
- It may be possible to specify something like "*.tiles.virtualearth.net" in the firewall.
-
How to edit the recent projects list ?
Close PV*SOL, open the ini file with a text editor and locate the node named "LetzteProjekte". There you can just delete the lines that you don't want, save the file and then re-open PV*SOL. The ini file can be found here: C:\Users\
Back to top\Documents\Valentin EnergieSoftware\PVSOL premium 2023\PVSOL.ini.
In addition the following is used: Port: 80 Protocol: http and Content Filtering may cause issues to IP 217.160.0.149
Back to topBuilding and site modelling
-
Which 3D formats can be imported in PV*SOL Premium ?
There are many 3D model formats and it can be a time-consuming process to establish compatibility. Download the following documents for further help. https://www.solardesign.co.uk/docs/PVSOL%202018%20Premium-%20%20Import%20of%203D%20models.pdf and https://www.solardesign.co.uk/docs/Hints%20for%203D%20import.pdf
Back to top
-
Can PDFs drawings be imported into PV*SOL ?
The only images that can be imported in 2D or 3D are simple graphic files such as JPG, GIF, BMP and PNG. However a PDF could be first scanned using say Windows ‘Snipping’ tool to one of those formats and then be used.
For 3D model import see this FAQ: https://www.solardesign.co.uk/faqpvsol.php#pvsolfaq_50 .
Back to top
-
Can you model a roof that has two different orientations in 2D?
In the PV modules tab, it is possible to copy or add arrays. Each array can have an independent orientation, module type and fixing.
On the Inverter page, it is then possible to combine multiple arrays for a system inverter.
In 3D, more options for configuration are possible.
Back to top
-
Can I plan the roof coverage for a PV system from the roof dimensions?
Yes, this is possible down to the nearest millimetre in either: (a) 2D 'PV Modules' then 'Graphic Coverage'; or (b) on 3D buildings then right-click > Edit
Back to top
-
How can I represent contours or undulations in 3D ?
It is possible to import terrains in 3D. However objects like PV modules can only placed on flat mounting surfaces on those terrains.
An alternative is to create a sequence of inclined flat surfaces adjacent each other. In reality it is in any case preferable to have the modules all facing the same orientation to simplify MMPT use. Hence this work-around in PV*SOL can still give good estimates.
For landscapes the following site creates contours that can be manually copied over a map and imported into 3D. These can assist in creating inclined open areas: https://contourmapcreator.urgr8.ch/
-
Can PV*SOL be compared to PVSYST ?
The key difference between simulation programs is the climate data and the models to calculate the irradiance on the tilted plane, especially if you have a 3D environment with shadows. Also the time step causes huge differences. There are adjustments for all these in the PV*SOL options so in principle it is possible to synchronise much of the input data and key algorithms to many other programs such as PVSYST.
In particular:
- LID: The light induced degradation goes into the module degradation in PV*SOL, which you can enter for each module area separately.
- Module Quality Loss: If you refer to a degradation of the overall module performance, you would enter this in the module degradation of PV*SOL.
- Thermal Loss Factor: This is a parameter of the PV module that you use. You can either just use a PV module from the PV*SOL database, or you can enter your own. There are three temperature coefficients: for the short circuit current in mA/K (or %/K), the open circuit voltage in mV/K (or %/K) and the MPP power in %/K.
- Module mismatch losses/string mismatch losses: There is an overall module mismatch loss factor in PV*SOL that you can enter in the project options, usually set to 2%. This will cope for the losses to expect from module mismatch (i.e. the fact that modules usually don't have the exact power output that is written on the datasheet)
- The real losses in the modules and strings due to shading are simulated with the help of a very detailed algorithm in PV*SOL. For each time step the shadows are determined then how many substrings of the module are shaded, calculating the resulting IV characteristics and finally overlay them to the string IV curves. From these (and the chosen working point) the losses are calculated
- IAM loss factor: This is also a factor that is entered in the PV*SOL module data. Back to top
Configuration
-
How do I use the 'SolarEdge' power optimiser and inverter system in PV*SOL?
From 2022 there is an automatic 'SolarEdge' configurator in the inverter dialouge.
Alternatively to use an approved configuration, a manual method is used: First search the Solar Edge resources website for the latest 'Application Note - How to Design a SolarEdge System Using PV*SOL'
In the PV*SOL manual configuration dialogue, the 'Power Optimiser' option is chosen. The same or different manufacturers can be chosen for the inverter and optimiser. With 'SolarEdge' you can use their online ‘Designer’ configurator to establish compatibility options. Then download their ‘String Design Report’ which will also show the configuration. Then manually copy that configuration into PV*SOL. If using 3D, the layout can also be manually copied. The ‘Polystring’ option is used especially when strings are connected over different roofs.
With this method, advice, warning or error messages can often be seen at the bottom of the PV*SOL screen. The critical ones will prevent a simulation but some messages don’t prevent this providing the 'OK' button is active. This may appear even if the main configuration inverter and MPP checks ‘pass’ with a green tick. These messages are often because PV*SOL calculates power limits using the nominal values of the modules whereas SolarEdge uses nominal power of their optimizers.
The mismatch losses are automatically adjusted as seen in the results Energy Balance. However changes to cable requirements are not automatic and should be tailored to the layout.
As an example with tandem optimisers with a total 46 modules, the configuration in PV*SOL would be on the SolarEdge inverter with one MMP: Nos. Strings x Nos. Optimisers [Nos. parallel x Nos. Series] i.e. 1 x 23 ☆ [1 x 2]
For large complex systems an interim spreadsheet is used to correctly tabulate and assign the string lengths and roof orientation in systematic order. Then in PV*SOL systematically create the same number of rows in each inverter as strings in the SolarEdge design. In general the workflow is:
- Subdivide the array into all the different compass directions in the module section. Enter or create the required number of modules and orientations
- Manually combine the all the arrays in the inverter section
- Create separate inverters with optimisers ticked often also using the Polystring option. Assign the correct inverter and optimiser models
- With larger tandem optimisers typically assign 1 by 2 as the default configuration and sequentially add the required number of rows – strings. Assign each row its own number to match the numbering used in SolarEdge
- For strings split over different roofs tick ‘Connect strings of same value in series’
- Work systematically down each string and assign number of optimisers and compass direction
- With tandem optimisers strings with odd number of modules will need an additional row, assigned as one optimiser and 1 by 1. Reduce whichever row number it belongs to by one optimiser
- Split string into different compass directions if necessary Back to top
-
How can a MPPT be allocated different parts of the strings ?
The use of the polystring option in the inverter configuration allows the strings to be manually allocated. Also in the case of system inverters, it is possible to choose inverters with less MPPs than the number of roof arrays which is normally not allowed. Care should be taken to allocate the correct number of modules of each roof area. The automatic configuration options are not used with Polystrings.
The easiest way to allocated strings is in the 3D configuration of PV*SOL Premium.
Back to top
-
What happens if I use 'Configure Modules Areas Together
If you select ‘Configure module Areas Together’ then the software doesn't search for inverters which can be configured to just one of the module areas individually. Instead each inverter must be configured to every module area and the module areas have to be on different MPP trackers. Also all inverters must have to be the same configuration (same string length and number at the MPP trackers).
This means that the modules of the individual surfaces must be divisible in such a way that modules of the surface ‘hang’ on each inverter. In addition, it must also be possible to form multiples of them so that all inverters have the same configuration.
It can be that only a small change in module number by even one module can be the difference of finding a combination. I always recommend seeking module numbers that are easy to divide and have multiple factors i.e. avoid prime numbers like 313 ! But in the end there needs to be common factors that give suitable string lengths. You can also try joining together just two of the three arrays. There may be other configurations that can work yet are not discovered by the ‘Configure module Areas Together’ function and so must be manually applied.
Back to top
-
Is there a limit to the system output in PV*SOL?
There is a limit of up to 7,500 modules mounted and up to 10,000 modules roof-parallel applying to a single 3D project. It possible to sub-divide larger projects into separate 3D projects for the purposes of layout, shade analysis and configuration. Thereafter if an overall economic or yield analysis is required, you can manually duplicate the configuration and shade losses into 2D where there is no overall limit. In 2D there is a limit up to 100,000 per array. Whilst there is superior analysis of the inter-row shading in 3D, indirect radiation loss can also be represented as a silhouette in the 2D sun-path diagram per array. When creating separate 3D projects, to avoid repetition of creating the terrain and other objects you could ‘Save As’ the current project as variants with different names and keep the same obstructions (if present) in all of them.
Back to top
-
Can ground and roof frame-mounted systems be simulated with PV*SOL?
Yes, in both PV*SOL program types, it is possible to select frame-mounted systems. In 3D visualisation, the inter-row shading is automatically considered by the program. In 2D this must be manually considered.
Back to top
-
How do I calculate the optimum row distance between modules for free-standing (mounted) arrays?
In general, such arrays/active surfaces should be within +/- 10 degrees of South (in Northern Hemisphere).
In 2D go to PV Modules > Graphical Coverage > Edit > PV Area > Modules Area then right-click on the module area. Choose 'Edit PV Area'. If available, click 'Calculate Optimum Row Distance' then OK twice to set the spacing according to a German rule-of thumb i.e. row distance calculated from the installation angle (Beta), the angle of the sun (Gamma) on 21 Dec at noon. Note in 2D inter-row shading is not automatically accounted for and must be manually added in the shade editor.
In 3D the 'Edit Assembly Systems' dialogue > Placing > Calculate then OK twice then 'Close'. When an area is now covered by under 'Module Mounting', the spacing is optimised according to the angle of modules. The inter-row shading is automatically considered in 3D.
Back to top
-
When can roof-parallel or roof-integrated module installation situations be specified during 3D planning in PV*SOL premium?
Under 'Module Coverage' once the modules are located, right-click > 'Edit' to be given the mounting and ventilation choices.
Back to top
-
Can PV*SOL calculate systems with physical tracking?
This is possible since PV*SOL 2016 and later versions with four types to choose from. (See Help menu > PV Modules for details)
Back to top
-
How can climate files be used from other specific sources like 'MCS', 'Solar-GIS', 'NASA' or 'PV-GIS'?
From 2022 there are direct options to use Meteonomrm, PV-GIS and Solcast climate databases. Manual entry of custom climate data is also possilbe (i.e. irradiation and ambient temperatures) is done via the monthly value import in the PV*SOL Meteosyn dialogue > Create climate data for New Location> Measurement data. To note, there are already several UK SAP climate files in the database which effectively synchronise with those used by the MCS.
In PV*SOL, most of the bundled climate files of hourly values originate principally from the Swiss company Meteotest but it quite possible to also make use of other datasets as well. Also there is a much wider range of climate data options from our other product Meteonorm.
It is possible to convert the same originating climate data from other calculation methods into PV*SOL although it should be stressed this will not automatically lead to obtaining the same annual performance results. Some alternative methods use only simplistic steps to obtain an approximate annual yield estimate; whereas PV*SOL considers such details as efficiencies, temperature and energy analysis down to a minute's resolution, along with voltage / current array configuration options. The consideration of part-load, shading and albedo are also quite distinct.
See also here: https://www.solardesign.co.uk/faqgeneral.php#comply and here https://www.solardesign.co.uk/faqgeneral.php#delivered
Back to top
-
Can I select "Tigo" power optimisers?
In the configuration dialogue, the 'Power Optimiser' option is chosen. This manufacturer can be manually chosen as an optimiser with other brands of inverters. The changes in mismatch can then be seen in the results Energy Balance.
Back to top
-
How do I use Enphase micro inverters?
Download a guide on using Enphase micro inverters in PV*SOL here: PV*SOL - using Enphase inverters
Back to top
-
Is it possible to choose which array/inverter the battery systems or hybrid inverters connect to ?
If there are multiple arrays with a DC-coupled battery system, it is possible in the battery dialogue to select the MPP to connect to. Only one connection can be assigned for all batteries. Similarly if there are multiple module inverters, it is possible in the battery dialogue to select which hybrid inverter the battery system connects to.
It is not yet possible to split battery systems across multiple arrays/inverters. In general, the assignment works as follows, depending on the type of coupling:
• AC coupling: In AC-coupled systems the battery systems are coupled behind the PV inverter after the AC/DC conversion. All module areas or module inverters are always coupled to all battery systems. The AC grid can charge the battery according to the charging strategy
• DC generator coupling: Here the battery system is connected directly into a DC line (MPP) between the PV generator and the MPP tracker of the module inverter. The AC grid cannot charge the battery
• DC intermediate circuit coupling: The battery system is connected to the hybrid inverter. The AC grid cannot charge the battery
In all cases above there is no timer directly associated with battery charging/discharging unless it is a vehicle battery. No stored electricity can currently be exported to the grid in PV*SOL.
Back to top
-
Can bifacial modules be simulated ?
It is possible in PV*SOL and PV*SOL Premium to analyse the additional yield due to bifacial modules. There are two ways to activate the calculation:
• 1. In 3D planning, a module array is created that contains bifacial modules.
• 2. Without 3D planning a bifacial module is selected and the installation type is set to ‘mounted – roof’ or ‘mounted - open space’.
In both case the selection of a bifacial module will automatically cause the calculations to be made that appear in the results. The albedo setting is always considered. However we recommend using 3D for the superior shade analysis.
Back to top
-
How can I model a grid-connected scheme so there is limited or zero export to grid ?
One way to simply prevent zero export in PV*SOL is via the AC mains options ('System Type, Climate & Grid') by setting 'Maximum feed-in power clipping' to Feed-in Point. This can be adjusted between 100% to 0% of the array power rating.
The limit can applied in two ways – by simple control by the inverter or by dynamic inverter control with CT sensors monitoring the export. The simple ‘At Inverter’ option will constantly reduce the inverter AC output. Whereas the ‘At feed-in point’ will only reduce the inverter output if the export limit is reached. This improves the self-consumption.
Without using the above options, the grid export can also be reduced by setting the Grid Concept to 'With appliances', battery storage and/or electric cars. All of these can then adjusted to reduce the export. It is best in this analysis that an accurate customer load profile is first input as half-hourly or minute level detail is needed for good accuracy. Certain key loads can be itemised individually as an ‘Individual load’ and adjusted using the daily and seasonal timers to match peak generation times using the results charts.
See also:Where are the results for power clipping or down-regulation found in PV*SOL?
How can self-consumption be maximised?
Back to top
-
How can self-consumption (own power consumption) be maximised?
This result is displayed in the Results > Simulation both as a % and an energy breakdown. When there is no feed-in tariff for export to the grid, it is more likely that an end-user will prefer to self-consume most if not all of the output of their PV array. In general, without batteries, it is difficult to achieve 100% self-consumption unless all the PV generation occurs exactly when is can also be consumed on site. The degree of this will depend on the interaction between consumption and generation within each hour or minute depending on the resolution chosen.
If export limitation is mandatory, for example by the grid utility, then this can be achieved on site with via inverter control and in PVSOL this is represented by maximum feed-in power clipping controlled either at the feed-in point (grid export) or simply just by the inverter.
See also: How can I model a grid-connected scheme so there is limited or zero export to grid ?Dynamic or 'smart' control of appliances/loads is not currently represented in PV*SOL. Whereas appliances on timers or light-sensitive switches can be in the Consumption > Appliances dialogue. Careful inspection of the graphical results will reveal the extent of what is possible.
Back to top
-
Are the wiring dialogues compliant with the wiring regulations?
There are wiring details available in 2D and 3D of PV*SOL that allow setting of the length, diameter, route and conductor type. Components, junction types and nodes can also be set. The 3D Configuration and Cabling in particular allow automatic and manual string layout to individual modules as well as direction. Both DC and AC energy losses at STC are indicated prior to simulation the total of these values repeated in the 2D Cables summary with PV*SOL Premium.
In all case the details of the wiring can be set by the designer who is assumed to be knowledgeable of the wiring regulations. When wiring details are proposed by default, the guide of less than 1% energy loss at STC assuming SWA surface mounted at STC is made. The proposed diameter to achieve this is shown but may need to be manually increased according to the specific site conditions.
Back to top
-
How to put Cable Plan schematics in the report
You must first display the cable plan, then select 'Page Preview' then the select 'Add to project report' button. The cable plan will then be visible in the screenshot manager.
Back to top
Results
-
Where are the results for mains voltage, power clipping or down-regulation found in PVSOL?
In the 'AC Mains' dialogue, there is an option to set 'Maximum Feed-in Power Clipping' either at the inverter or the grid feed-in point. When this is set, the detailed results vary depending on the settings. In any case the effect can be easily observed for annual values in the Results > Energy Flow graph. Note both options de-rate use the inverter to achieve the export limitation.
If you plan a grid connected system then for grid-connect systems adjusting the mains voltage value has no effect other than display on the circuit diagram. For off-grid systems the program checks if the battery inverters nominal voltage matches the internal 'grid' voltage. Depending on that you can use a battery inverter or not.
For power-clipping/down-regulation download the following help sheet 'Power clipping or down regulation by inverter or feed-in point in PVSOL'to find these results.
See also: How can I model a grid-connected scheme so there is limited or zero export to grid ?
Back to top
-
Why do I get such a difference in yield in the simulation of different modules, even though they have the same rated power?
Usually the reason for that is the part-load operation behaviour of the modules. The specific data for every module is entered in the database by the manufacturers. They have the option to enter a specific part load operation point for their modules in our database; then a specific part load operation curve is calculated for the module.
If the manufacturer doesn't enter the specific part-load operation point and you select the "standard part load operation" option, a curve for the cell type is used (e.g. monocrystalline) for the calculation.
To ensure that the program never simulates yields which are not achievable in reality, the standard part load operation curve tends towards a pessimistic scenario. Which part-load operation curve is used for the selected modules can be seen on the "U/I Char. -Part Load" tab under "Databases" => "PV modules".
Back to top
-
Why is the specific annual yield for amorphous modules better than for monocrystalline modules, even when the systems are the same size?
The decisive factor for the yield is the part-load efficiency. In this respect amorphous modules usually have a better efficiency than monocrystalline modules. The part-load efficiency is presented in the efficiency characteristic curve which can be displayed under Databases > PV Module > 'U/I Char. - Part Load' by clicking the 'Efficiency Char. Curve' button.
Back to top
-
How are thin-film modules treated in PV*SOL calculations?
All modules are calculated with the part-load characteristic curve (efficiency or 'ETA' curve). The specific part load operation for the modules is in some cases given by the manufacturer (see Databases > PV Module > 'U/I Char. - Part Load').
In all other cases a characteristic curve is used that is specific to the cell type. It is possible to select from 12 different cell types. For the 5 thin film types: amorph, HIT, CIS, CdTe and triple a-Si, standard characteristic curves are available for typical part-load operation.
Back to top
-
Can you print the roof layout in PV*SOL?
In 3D projects you can export/print the roof layout via the options in 'Project Report' - Overview or Dimensioning Plan. In 2D the graphic roof layout will be the choice. In 3D, the 'Snapshot' feature also allows captured images to be placed in the report.
Back to top
-
Would it be possible to guarantee that the predictions generated using PV*SOL will be matched by the actual output after installation?
The margin of error of user input data versus experimental means there is no guarantee that modelling will synchronise exactly with on-site measurements; neither can it be expected that any given month, day, hour or minute will match that in the modelling since climate and load values are acquired as historical averages.
Nevertheless, the margins of error can be reduced if on-site measurements are made to the nearest millimetre or tenth of a degree. Furthermore, module characteristics are best checked randomly to ascertain individual power outputs which otherwise can vary from labelling.
Financial predictions are at risk from future variances in inflation, tax and interest rates. A default caveat is provided with the reports.
Back to top
-
Does the PV*SOL system schematic show isolators on the report to the customer?
From versions 2019 onwards, the cabling schematic can be customised with user defined items. In any case the default schematic can be exported into a graphic or CAD package for further customisation.
Back to top
-
How do I get results for the module temperature during operation?
Run a simulation and choose the options in the Diagram Editor graphical results. Now select 'Module Temperature'. Right click on the area and they data can be copied to a spreadsheet.
Back to top
-
How do I create results for every half-hour of year ?
In summary, a minute-level simulation is first saved as an Excel file which is then converted inside Excel. The data can then be averaged for any preferred time-resolution greater than one minute.
If you have been on one of training courses we give you a working example of how to do this.
Back to top
-
How are the terms Gross PV Surface Area and PV Solar Surface Area defined? Why are the values different in some cases?
The PV Solar Surface Area is the area that forms the basis of the manufacturer's measurement of module efficiency. For simulation, the program determines the Solar Surface Area from the calculated power and efficiency (ETA), using the following formula:
PV Solar Surface Area = Nominal output (STC) / (1000 W/m2 * ETA(STC))
In some cases, the resulting figure is different from the Gross PV Surface Area. If, for example, the manufacturer does not take the module frame into account when calculating the ETA (STC), in order to obtain a better ETA (STC), the Solar Surface Area will be smaller. For a Solar Surface Area that corresponds to the Gross PV Surface Area, you should click on the calculator symbol to calculate the Module Efficiency.
Back to top
-
Where are the losses due to shading shown?
The results differ between using 2D and 3D and dependent on the number of arrays. If there is no shading, the values of zero are reported in the Energy Balance and the Excel results under ‘Shading’ and other similar column headings. If 2D shading is present then accordingly non-zero values appear. The partial module shading and mismatch from shading is not considered in 2D. In 3D this same value is termed as ‘Module Independent’ i.e. where affecting all modules equally. The ‘Shading’ column in the Excel spreadsheet represents the module independent shading whether in 2D or 3D. Shading is also shown in the diagram editor. Non-zero values for partial and mismatch are only shown for 3D.
In 3D, effectively two simulations are done one with and one without shading to report the ‘Yield reduction due to shading' in the Simulation results even if only shading from the far horizon. This is the total loss of yield due to the influence of shading including direct shading losses, low-light performance (lower efficiency) of the module and the MPP tracking of the inverter if the shading causes a MPP outside the MPP voltage range. Mismatch and Partial are also now itemised in 3D. Module-specific shading is also reported under the Energy System balance and Configuration.
The shading frequency is available in 3D if near or middle distance shading objects cast a sharp shadow on the array. This is indicated as a percentage of the year during daylight that the module is shaded.
Note: The self-shading of mounted module rows is factored in automatically only in the 3D-Visualization. Minute values for global irradiance are especially important for the realistic simulation of yield losses.
Back to top
-
How are the electricity production costs calculated? ?
To calculate the electricity production costs:
1. The investment costs are divided by the number of years you have entered for the assessment period.
2. The annual cost are added to this value, if existing.
3. Then the total costs are divided by the PV generator energy (AC grid).
Back to top
-
What is the definition of the performance ratio (PR) ?
In PV*SOL the Performance Ratio is calculated as follows:
Performance Ratio = (PV Generator Power + Stand-by Consumption) / ([{Global Radiation at the module - Reflection on the Module Interface} x Size of the PV field] * [Module efficiency / 100])
•PV Generator Power (= Grid-Feed-In with full feed-in)
•Stand-by Consumption
•Global Radiation at the module
•Reflection on the Module Interface
•Size of the PV field
•Module efficiency
The above values can be found in the energy balance. The mathematical sign of the values have to be considered, if you use them in the above formula.
Back to top
-
How is the peak consumption power calculated and how can it be changed ?
Peak power consumption is displayed in the consumption dialogue and used to assist with the choice of battery inverters with Battery System.
Consumption charts and exportable tables down to one minute resolution can be found on the Results Page > Diagram Editor. The hourly plots are also shown in the Consumption dialogue > Time Series.
For individual appliances see this FAQ: https://help.valentin-software.com/pvsol/en/calculation/consumption/
Dependant on the format of the consumption will alter how the peak power is calculated. The choice of one hour or one minute resolution will also affect how this value appears in the exported tables. Note that if the overall calculation is set to one hour resolution, then the consumption is assumed to be constant across each hour. In this case, an individual appliance originally created with an operating time of 15 minutes per hour would be simulated as a device that runs for 1 hour with a quarter of the load. If subsequently the general calculation resolution is changed to minute resolution there would be 15 values shown of the same power per minute for 15 minutes and so the peak power would be displayed the same.
Load profiles from daily profiles are created as hourly. A higher peak value can be created if all the daily consumption is set to occur in one hour @ 100%. The lowest peak occurs if spread equally over 24 hours @ 4.16%. Alternatively simply add a short-term use appliance to a base profile that operates for example 1 hour on one day at midday in summer.
For load profiles from measured values the highest power found will be reported regardless of resolution. However if original consumption values were imported at resolutions less than one hour and subsequently the general calculating resolution is set at one hour then the values are averaged in each hour. The peak power is still reported correctly as above but if the final consumption values are exported in hourly mode then the peak values will appear less as they would have been averaged.
Back to top
-
How can I change the images used in the presentation report?
The image on the front of the report is independent of any other shown inside via the Project data scree. This is controlled in the Project Data section were you can add any extra images.
You can chose your own photos from any 3D viewpoint using the camera snapshot icon inside 3D. Once taken in the Screenshot Manager, right-click your preferred image and allocate as the Overview image. If using 3D, the overview photo can also be switched off via the program options and saved as a presentation template.
Back to top
-
How can the results chart 'Cumulative Total Energy Generation' show just the AC inverter generation ?
The graph normally shows the balance between generated PV energy (yellow) and the demand (grey). To display just the cumulative generation on this chart, temporarily adjust the consumption to the smallest amount = 1 kWh. The chart can then be manually copied and appended to the report in Word if required.
Back to top
Database Questions
-
How do I import a load profile such as Half-Hourly (HH) from a Smart meter?
From 2020 the consumption dialogue allows HH import to be selected. The import can be done using various resolutions from per minute to hourly. For detailed instructions see 'Consumption' > 'Import Load Profile' >'Import New Load Profile'. Then press 'F1' for context help.
In the case of importing leap years the calendar must be used to for one of the leap years. If the year the data is less than a year then the start date and number of complete data days are chosen. The extra or missing days will not be shown in the results as these will instead be interpolated. In the results only complete year @365 days are shown.
We recommend first using Excel to analyses data before import in case of accidental missing days. With persistent file import problems also inspect the file with a plain text reader such Windows Notepad. If duplicate commas are discovered then try cut/paste on the affected column or use a Find/Replace feature found in a 3rd party app Notepad++.
Back to top
-
How can I find out whether the latest version of the module database is installed on my PC?
Assuming the licence has a current software maintenance agreement then the program will automatically check for updates and additions to the database if you select from the menu 'Options' > 'Program Options'. From 2020 the databases are stored online.
You are also able to carry out an 'Update Check' manually via the Menu > Help > 'Check for Updates'
Also further information is found via the Menu > Help > Info. The date and version is shown for the file PV*SOL.sdf
Back to top
-
How do I add modules, batteries or inverters I want to use to the database?
Manufacturers can add the technical data of their products themselves to the PV*SOL online database. To do so manufacturers first send an email to database@valentin-software.com with their company contact details and then they will be provided with the login details. Also see further at this link: https://pvsol-database.valentin-software.com/
A user can also create custom modules, inverters & battery systems via the PV*SOL Main menu > Database > Module/Inverter/Battery. Using the icons at the top of the dialogue, you should then either:
- create a copy of a similar existing product and rename/alter as required
- or create a new entry from the icons at the top of the list.
Only copies can be made of system files which cannot otherwise be altered except be the original manufacturer that uploaded it to the central database. Users can also a request to their equipment distributor to update so that ultimately the manufacturer uploads the correct specification for everyone to access as above. If they have a copy of PV*SOL they can email you a saved project with that module and it’d then appear in your database as well. If you have the specification sheet there is a good chance it’ll be similar to an existing item hence you might start with a database copy of that.
From the 2020 versions user customised databases are stored online and can be easily shared with other users. See Main Menu > Options > Database Options
To note battery systems are a combination made up of batteries & battery inverters. The latter do not have their own database but are often mentioned in the title description in the battery systems description.
Back to top
-
Where does the data for determining the carbon dioxide (CO2) savings come from? ('CO2 Emissions avoided' in the project report.)
The database delivered with the program includes a generic value of 470 g/kWh. This should be adjusted to the applicable country via 'Climate, Grid and System Type' > 'AC Mains'
Further information for the UK can be found here: https://www.solardesign.co.uk/pvsol_emission_factors.php
Back to top
-
How to adjust the CO2 grid rate over time ?
To account for module degradation over time, use the 'PV Energy during Observation period' chart in the results. Right-click and copy table to clipboard. Then paste in a spreadsheet to total the energy of the period of years set in the Financial section. Within the spreadsheet a diminishing CO2 rate can then be applied to each year and then totalled.
Back to top
-
How do I copy over my user-created database items and favourites when changing my program version or transferring my licence?
From 2020 an online database is used which can accessed from any licence holder or computer providing the user ID are remembered. These can be found in the program options.
Prior to this to 2017 many of details are stored in each saved project. These are then automatically transferred to another computer when that project is opened. This works for all tariffs, modules, inverters, battery systems, batteries, optimizers and electric vehicles.
Another way would be to copy the whole database file “pvsol.sdf”. It is located in the following directory 'C:\ProgramData\Valentin EnergieSoftware\PVdatabase\Version5.0'. This folder is normally hidden, so enable the option "Show hidden files and folders" in the Windows folder settings.
If you have custom load profile to import then these are stored in the “ConsumptionDb.sdf” under “C:\ProgramData\Valentin EnergieSoftware\PVdatabase\Version5.0”. If you want to transfer them you would have to copy this file.
The self-created climate data records are stored under “C:\ProgramData\Valentin EnergieSoftware\MeteoSyn\WBV\_userfiles” in the different country folders. You have to either copy all the individual files or the entire country folder to the new computer.
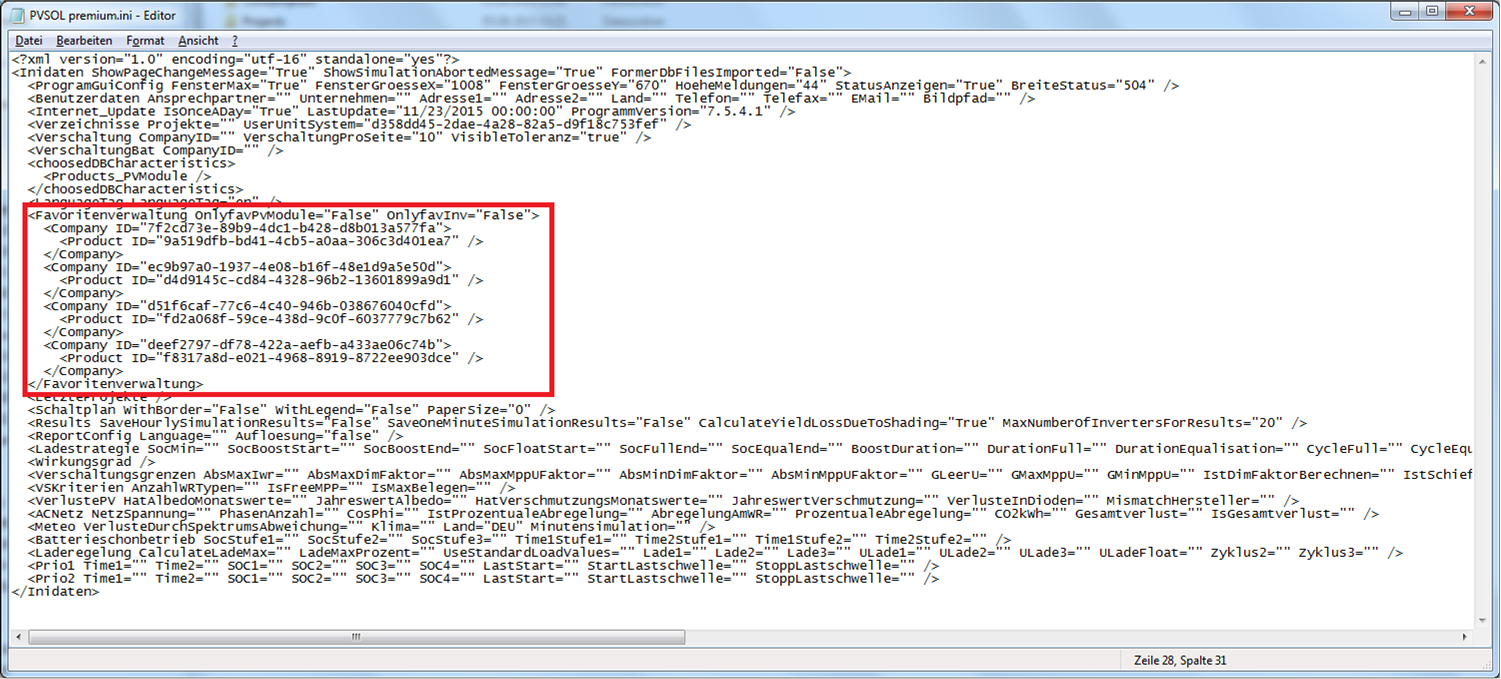
To copy of any favourites, these details are stored in the program's 'ini' file. Do not copy the whole file, just the part indicated below:
- Close both programs
- Using Windows Files and Folders, navigate to the following directory on the newer PC:
- C:\Users\
\Documents\Valentin EnergieSoftware\PVSOL premium 2018 - Right-click on "pvsol premium.ini" and 'Copy' then 'Paste' a temporary back-up copy to your Desktop. Rename it if wished. If all goes well this file can be deleted later.
- Then right-click again on the original "pvsol premium.ini" and 'Open With' a simple editor such as Notepad
- Scroll down and select & copy (Right-click then 'Copy') everything between and including the terms "Favoritenverwaltung" which appears twice as it is marked in the screenshot below. The number of items found items will vary depending on how many favourites were previously saved.
- Open the current pvsol premium.ini" The file can be found under: "C:\Users\
\Documents\Valentin EnergieSoftware\ " - Paste everything in the same place, overwriting everything between and including the terms "Favoritenverwaltung" which appears twice
- Open PV*SOL premium. The favourites should now be in the new version
Any selections in the User and Extended Program options like the company logo, units and language choices should be manually set and the logo re-imported.
Back to top
-
Why can't I find some brands of battery systems in the battery system database?
The brand name used in the listings can vary between the battery or inverter manufacturer. It is possible to design for grid-connected AC-coupled, DC-coupled or hybrid (DC-intermediate) battery storage systems as well as off-grid. Some grid-connected battery systems on the market.
It is possible to add a battery of any brand / model to a user-created custom battery system and then add a name of your own choice assuming the technical details are known.
Note if a hybrid battery system is used, the same type of module inverter should be selected.
Back to top
-
Are there load profiles suitable for the Southern hemisphere?
If a load profile is imported from say a smart meter that was already based in the Southern hemisphere then the seasons and months will already be synchronised. If a profile from the Northern hemisphere is found, such as those that come bundled with the program, then the months must be inverted to match the different seasons. This can be done from the results Excel spreadsheet option where the load profile can be isolated in either hourly or minute resolution. The data can then be manually inverted so that summer becomes winter etc. then saved as a CSV format. This can then be re-imported back into PV*SOL with a new file name. Alternatively when creating a measured-value profile there is a simple option 'Shift load profile by half a year'.
Back to top
-
How do I select 'From-grid' electrical tariffs that vary during the days or seasons?
There are so many variants of this appearing every day that you are likely to need to create a custom one to match your customer's local supplier. First view one of the Example Projects > ‘Example TOU’(= Time-of-use). Open this and navigate the ‘Financial analysis tab > ‘Select’. This is opposite the Net Metering section. Then right click > Edit on either ‘Example Rate Net Metering’ or ‘TOU Polyphase’. Viewing these will help you understand how that dialogue works. Now you will more easily save a new tariff for your own country.
Back to top
-
How do I view the part load data for a module?
For part load data, follow this file path: Main menu > Databases > PV Module. Then right-click > Edit
Back to top
-
Can PAN format files for modules characteristics be imported into PV*SOL?
Yes from 2022 a direct import is possible. The PAN format is a proprietary (and binary) format from PVsyst which you cannot directly open in PV*SOL.
An Excel template can assit manual PAN format export: 'PAN files for PVSOL.xlsx'
You would then open the PV module database of PV*SOL, then choose "New module" and enter the data accordingly.
Back to top
-
What is the ‘Emissions Coefficient’ in the module database specification ?
This parameter is a leftover from the old programs PV*SOL Pro and PV*SOL Expert. It was used for the thermal balance equation in the dynamic temperature model. But this temperature model is not used anymore in the current versions. The manufacturers can also not enter the value anymore in the online database. Nevertheless the parameter is still in the database because of the old modules which we not delete. If new modules are entered then the value is set to an default value. i.e. 85 %.
Back to top
Definition of Terms
-
Where can I find definitions of common terms used in the PV*SOL report?
Go to the Help menu > Glossary.
Back to top
-
What is the 'energy from grid'?
The energy from grid consists of the property's electricity requirement which is met by the grid (if connected), plus the PV system's own requirement for inverter stand-by and night use.
Back to top
Economic Questions
-
Why can I not see the choice for Surplus or Net metering concepts instead of only full feed-in? And why does the From-grid tariffs or Bankability sometimes not appear in the Financial Analysis ?
These options are affected by the previous choice of ‘System Type’ in the dialogue ‘System Type, Climate and Grid’.
For grid-connect systems if there are no Appliances enabled then the financial choice is only Full-Feed in with Bankability.
If Appliances are enabled then first the annual load must be entered there and then you will see there is a choice of finance of Surplus or Net metering. Plus the from-grid tariffs are now considered.
All tariffs can be defined at any time through the main Menu ‘Databases’.
Back to top
-
How do I use the current UK FiTs in PV*SOL?
These including the SEGs are available in the Tariffs selection of the Financial Analysis. Both the Export and Generation tariffs are separately applied. Options to use 50% deeming are also available.
If the latest ones are not shown then you can easily add your own based on a previous one. In the database view, right-click and copy an existing tariff. Rename to suit the new period and change the 'valid from' date. Then adjust the tariff rates that are different by comparing to the official announcements from OFGEM. Then click 'OK' and the new tariff will appear in your list. Repeat this for the different building classifications and export tariff as required.
Back to top
-
I have to load my preferred feed-in tariff each time I set up a new project. Is it possible to save the tariff settings to be used for new projects centrally?
The best way to use PV*SOL is to create some templates on which to base future projects and in this way many options do not have to be repeatedly entered. There are also frequent choices in the program to save favourite climate, module, inverters and other dialogues 'Save as Default'.
Back to top
-
Does PV*SOL know the capital cost or exchange rates of any items?
In short, no. However in the Financial Analysis, it is possible to use normalised costs/kW, and these can be stored as template projects. The 'Detailed' view on these allow individual items to be summed.
Back to top
-
In the results, why does the Feed-in/Export tariff cash flow rate change every year and differ from the utility payment ?
These values are affected by the module degradation, inflation of the feed-in tariffs (or third party resale) and annual average return on capital (otherwise employed). The latter can be considered the opportunity-loss of interest-bearing capital that would otherwise be gained if the PV project had not proceeded.
For cashflow tables, degradation and inflation rates are applied on a monthly basis over the entire assessment period. This is applied from the start of the first year. If the start of operation is a part-year then the first year will not match subsequent years. Whereas in the results, 'Total payment from utility in 1st year' is shown as if a complete year.
Back to top
-
I am involved with a Power Purchasing Agreement - how is this represented in PV*SOL?
More complex arrangements are best created in a separate spreadsheet after copy/pasting the cash-flow table in the results.
However, there is the option within the program to use 'Price of Electricity sold to Third Party' in the Financial Analysis dialogue [currency/kWh]. This is used to calculate the income from the electricity that is not compensated by the power company but is sold directly to third parties at market prices.
If entered, this rate is multiplied with the grid feed-in (export energy to grid). If a feed-in tariff is selected, then this is first used for the calculation of the income. Only if the feed-in tariff is not used or has expired then the third party tariff is used. The third party tariff is also used if you have defined that you are not paid for the full amount of the feed-in energy such as when the feed-in tariff contains an un-compensated portion of the electricity.
Back to top
-
What effect does the starting date have on the economic calculation?
The starting date is adjusted in the initial project date tab. The default is the date of first creating the project. If there is a mismatch of this date and any defined tariffs such as Feed-In tariffs then a non-critical advisory message appears at the bottom of the screen and so you may wish to adjust the starting date or adjust the choice of tariffs before completing the project.
If you chose the 1st of January the first year’s economic calculation will then run from the January 1st to December 31st. For any other staring date in the year the first year’s economic period is from the starting date to the end of the month before the starting month e.g. If the starting date is set to 31 December it goes from December 31st to November 30th. All other years are counted as complete 365 days.
If the starting date is other than the first of the month, the shortfall of the ‘lost’ days in the first year is calculated from the mean daily feed-in rate (energy export to grid) multiplied by the number of ‘lost’ days multiplied by the chosen feed-in or third party rate.
Back to top